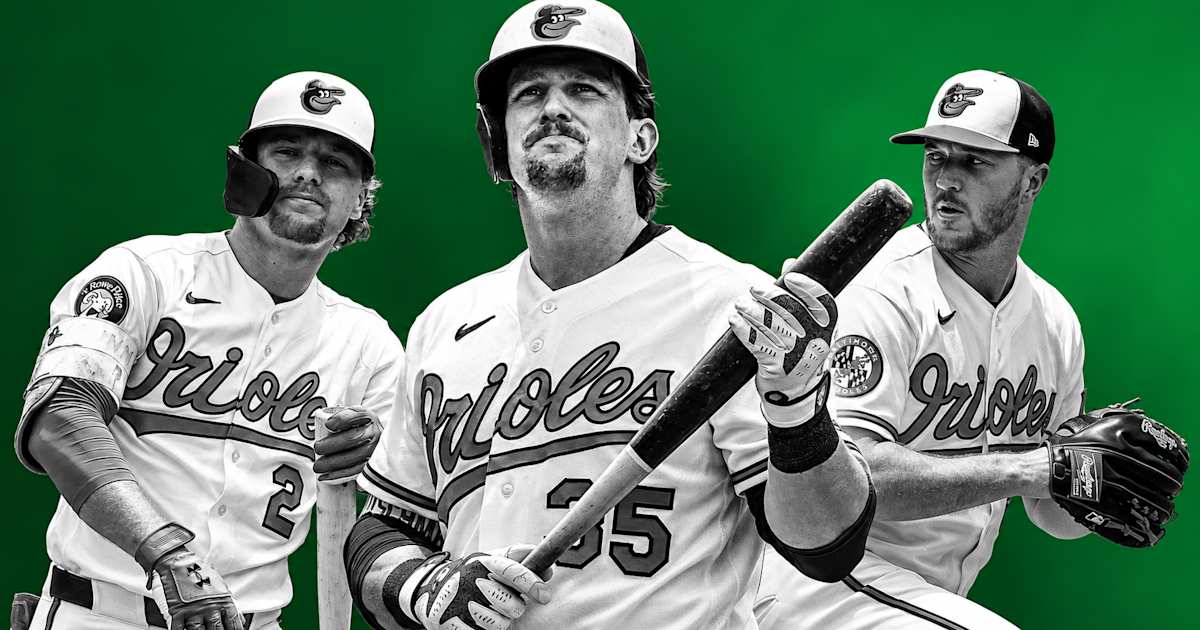

In early March, we published personalized benchmarks for ten core players that we thought would be most central to the Orioles' 2026 season. These benchmarks weren't just generic league-average bars, but targets calibrated to each player's role, history, and what the team actually needed from them in order to succeed. They were designed to limit talk of, "did he have a good year", and was more concentrated on, "did he do the specific thing the team needed". We based them on a simple proprietary player projection model, which you can read about more in depth in our article from the late winter.
With the ultimate decision to cancel game 162 for the Orioles on Sunday, the 2026 season is officially over. Baltimore finished 79-82, and for a second straight year they missed the playoffs. On top of that, they traded their franchise catcher in August, which signaled to the fanbase that the painful rebuild of the past seven years didn't pan out the way it was intended. There's been a lot of talk of who is at fault.
Do the players shoulder most of the blame? The front office? Injuries? We took a look back at our preseason expectations for each of the 10 "core" players based on projections rooted in our proprietary player projection model. Here's how they measured up against their targets from Opening Day.
The Scorecard
Player | Benchmarks | Met |
|---|---|---|
Pete Alonso | SLG ≥ .500, HR ≥ 35, Barrel% ≥ 15% | 3/3 ✅ |
Jackson Holliday | K% ≤ 25%, BB% ≥ 9%, OBP ≥ .320 | 2/3 |
Trevor Rogers | ERA ≤ 3.50, WHIP ≤ 1.25, IP ≥ 130 | 2/3 |
Shane Baz | ERA ≤ 3.75, FIP ≤ 3.75, IP ≥ 140 | 2/3 |
Kyle Bradish | ERA ≤ 3.50, K/9 ≥ 9.5, IP ≥ 130 | 1/3 |
Ryan Helsley | ERA ≤ 3.25, K/9 ≥ 11.0, SV ≥ 35 | 1/3 |
Gunnar Henderson | xwOBA ≥ .370, HR ≥ 30, Barrel% ≥ 10% | 0/3 ❌ |
Adley Rutschman | xwOBA ≥ .330, OBP ≥ .340, BB% ≥ 11% | 0/3 ❌ |
Colton Cowser | xwOBA ≥ .325, K% ≤ 28%, Barrel% ≥ 12% | 0/3 ❌ |
Jordan Westburg | xwOBA ≥ .325, SLG ≥ .450, G ≥ 140 | 0/3 ❌ |
Out of 30 individual benchmarks tracked across 10 players, 11 were met. We ultimately decided to remove Adley's benchmarks from the core's total since he was traded in August. Therefore, 11 out of 27 is just a 41% pass rate. One player fully delivered. Three came close. Six came up short.

Pete Alonso
3/3 benchmarks met · SLG .522 ✅ · 43 HR ✅ · Barrel% 15.3% ✅
Pete Alonso was everything Baltimore paid $155M for. He led the American League with 43 home runs, the most by an Oriole since Anthony Santander hit 44 in 2024, and he did it with a barrel rate (15.3%) that confirmed the contact quality was real. His slugging percentage (.522) cleared the .500 target with room to spare. On top of this, he was arguably the best baseball player in the American League in the final two months of the season.
The franchise investment was fully justified. The troubling part is that one player hitting 43 home runs on a team with the hardest average exit velocity in baseball still couldn't carry the offense to October. That math says more about the rest of the lineup than it says about Alonso.
He called the fans back onto the Camden Yards field after the final home game and saluted them. He deserved to be doing that in October.

Jackson Holliday
2/3 benchmarks met · K% 23.7% ✅ · BB% 9.6% ✅ · OBP .300 ❌
This one may be a bit of a shocker for some. I'll preface by saying that we had relatively low standards for Holliday coming into the season. After all, he's still quite young and we removed the fact that he was a number one overall pick from the equation. In reality, he was supposed to clear all three of these this year as a 22 year old. The benchmarks for these were set before his hamate injury in spring training, so take that for what it is.
Holliday cleared two of his three benchmarks, his walk rate (9.6%) and strikeout rate (23.7%) both moved in the right direction. But the hamate injury that cost him significant spring and early-season time put a ceiling on the full-season numbers, and his OBP (.300 vs. a .320 target) didn't fully recover.
The OBP miss is partially attributable to the lost time and the cold-start effect after surgery. His second-half numbers after recovering were the kind that make you believe in the upside. Holliday at his floor looks like a useful piece. Holliday at his ceiling, which we saw in stretches post-injury, looks like an above-average major leaguer. He's 22. The development arc still points up, but he needs to have a bounce-back year next season in order to prove that he's worth of the number 1 overall pick in 2022.

Trevor Rogers
2/3 benchmarks met · WHIP 1.18 ✅ · IP 169.7 ✅ · ERA 4.03 ❌
Rogers cleared two significant hurdles: he threw nearly 170 innings and limited baserunners at a 1.18 WHIP, better than the 1.25 target. The question at the start of the year was whether a pitcher who'd looked like an ace over a small subset last season could sustain that over a full season. The sustained WHIP and workload say yes, at least partially.
We knew going into the season that Rogers wasn't going to be able to sustain the dominant sub 2.00 ERA he put up in 2025. The 2026 ERA (4.03) represents an expected regression, but outside of a bad stretch in the early part of the season, he looked very dominant from June 1st onwards. During the tough stretches, the sequencing and contact suppression weren't where they needed to be, and he squandered runs and hits in a lot of 2-strike counts. But, from June 1st onwards he posted a 2.90 ERA over 20 starts (the best in the rotation), 12 of which were quality starts. Ultimately, a 170-inning season with a sub-1.20 WHIP and a sub-3.00 ERA for 4 of the 6 months of the season is top-of-rotation quality.

Shane Baz
2/3 benchmarks met · FIP 3.60 ✅ · IP 179.7 ✅ · ERA 4.11 ❌
Baz led the rotation in innings pitched (179.7) and, by process metrics, was arguably the team's best pitcher. His FIP (3.60), which strips out defense and sequencing luck and measures what the pitcher actually controlled, cleared the 3.75 target. He unfortunately was given no run support in games that he started this year. In 31 starts, the team averaged just 3.34 runs per game, which is the 3rd lowest among all qualified starters in Major League Baseball this season.
His ERA of 4.11 is a little higher than we'd want. He did have starts where teams got to him, and he squandered some big innings. But, the FIP/ERA gap suggests some bad luck in key moments. As a signing, Baz exceeded expectations: he came to Baltimore and delivered durability and genuine mid-rotation talent. The ERA was the only real miss, and the FIP says it shouldn't define how we read his season. Overall, a great addition to a rotation that really came into its own this season.

Kyle Bradish
1/3 benchmarks met · IP 155 ✅ · ERA 4.12 ❌ · K/9 8.25 ❌
The good news for Bradish coming off of Tommy John surgery, he threw 155 innings this season. For a pitcher who had missed almost two full seasons due to the injury, clearing the 130-IP durability target was an enormous step.
The bad news, the effects of the time off and injury may have affected his performance this season. His Location+ metrics, which evaluate command and placement, essentially from looking at where the pitch ends up in the zone relative to the count and situation was 98. A score of 100 is considered league average, so overall, he was operating below average with his command. This was especially true for his changeup (76 Location+) and Slider (89 Location+). The changeup isn't a big part of his arsenal, but his slider is. Without command of that pitch, it was hard for him to be the dominant Bradish we know he can be. His K/9 (8.25) fell well short of the 9.5 target, and a 4.12 ERA reflects a starter who was giving up more damage than hoped.
Even with struggles to hit his spots, 12 of his 29 starts were quality starts (6+ IP with 3ERs or fewer allowed). He also landed a nice long-term contract with the team, so the question for the future is whether Bradish can regain his command and consistently show how dominant he can be on the mound. We saw it for long stints this year, but his last few starts were quite rocky.

Ryan Helsley
1/3 benchmarks met · K/9 12.33 ✅ · ERA 4.11 ❌ · SV 8 ❌
Helsley's 2026 was derailed by elbow inflammation that limited him to just 8 saves. The closing job he was acquired to do largely didn't happen. The raw strikeout rate in the innings he did pitch was legitimate (12.33 K/9, above his 11.0 target), suggesting the stuff was still there when he was healthy and on the mound.
But, you can't close games from the injured list. The 8 saves were telling: the team behind Alonso needed a reliable ninth inning closer, and Helsley couldn't provide it for most of the year. The K/9 number gives you hope for 2027, but this year was essentially lost. It's disappointing given he posted 21 saves in 2025. He's on a two-year contract with the Orioles, so if we play baseball in 2027, let's hope he is back healthy.

Gunnar Henderson
0/3 benchmarks met · xwOBA .322 ❌ · HR 24 ❌ · Barrel% 7.7% ❌
Woof. Like many, we were very high on Henderson's 2026 outlook in February and March. No surprise that he was the most concerning result in this report. He missed all three benchmarks, and not narrowly. Albeit, our benchmarks for Gunnar were very high, considered at "MVP level". However, heading into this season, we all thought that was the type of player he was and is. His xwOBA (.322 vs. .370 target) suggests his contact quality was average, not elite. His barrel rate (7.7%) was well below the 10% floor. He hit 24 home runs, which is fine for a shortstop, but a significant step back from the 37 he hit in his 2024 MVP-caliber season.
At 25 years old with two years of team control remaining, the question surrounding Henderson has shifted from how good can he be to is the 2024 version coming back. His underlying Statcast metrics: xwOBA, barrel%, exit velocity all point toward a player who isn't squaring up the ball with the same authority he was two years ago. That could be a mechanical adjustment, a pitch-sequencing response from opposing pitchers, another injury (it's reported he was dealing with wrist soreness this year), or an early plateau. We don't know which yet.
What we know is this: if the Orioles are going to compete in 2027 or 2028, they need Henderson back near his 2024 form. This year's data does not give confidence that it happens automatically.

Adley Rutschman
TRADED AT THE DEADLINE
We can't really finalize our benchmarks for Adley. He was traded to Boston on August 3rd, with Baltimore sitting 54-58 and roughly 10-15% in playoff probability. His pre-August OBP (.331 vs. .340 target) and walk rate (14.1% vs. 11%) showed that he did a good job of getting on base. He also had multiple stretches this season as an Oriole where he led the team in OPS and was selected for his third All-Star game.
The pre-August xwOBA (.348 vs. .330 target) was great, suggesting the underlying contact quality was there. But, he landed on the IL three separate times before being traded and consistency plagued him again in 2026. Regardless of his performance, the Adley chapter is closed in Baltimore. The benchmarks, fairly, say he did quite well, but we can't fully capture what his impact would've been on the 2026 Orioles given he was shipped away at the trade deadline.

Colton Cowser
0/3 benchmarks met · xwOBA .315 ❌ · K% 30.9% ❌ · Barrel% 9.4% ❌
Cowser's 2026 was a repeat of 2025's core problem: too many strikeouts, and the barrel rate that made him intriguing (14.1% in 2025) didn't hold up across a full season (9.4%). A 30.9% strikeout rate is untenable for a player who needs to make contact to play his profile. His xwOBA (.315) fell below even the contact-adjusted floor we set.
He's 25 and when he makes contact, it tends to be hard contact. But the same evaluation written about him after 2025 applies again here: until the strikeout rate comes down, the hard-contact profile can't translate into actual offensive production. The 2026 season was supposed to be when the contact issue resolved itself. It unfortunately didn't. He has since been relegated to more of a platoon role given his struggles against left-handed pitching. He came through in some big moments for the team this year with his bat as well as his glove, but it seems like he may be falling off of the Orioles core players list headed into 2027.

Jordan Westburg
0/3 benchmarks met · Did not play (partial UCL tear)
We debated on whether or not we should count Westburg's benchmarks for 2026. Given he didn't play an inning of baseball for the team, it may not be a fair assessment. However, not playing is also a tell as to whether or not the core is delivering. A partial UCL tear kept him out for the entire 2026 campaign, and his benchmarks: xwOBA ≥ .325, SLG ≥ .450, G ≥ 140 were never tested.
When healthy in 2025 (85 games), Westburg posted the production the benchmarks were targeting. The underlying player is there when the health is there. The 2026 loss is genuinely unfortunate: a massive piece who could have changed Baltimore's offensive (and defensive) calculus being absent for the entire season is not a small thing.
The question for 2027 is whether the UCL heals cleanly and whether he can approach the 140-game target that was, until the injury, not an unreasonable ask. Or maybe it is an unreasonable ask at this point since Westburg hasn't posted a season in recent memory where he started more than 100 games. We'll see.
What 11-of-27 Tells Us
A 41% benchmark pass rate is a fair reflection of what happened. One player fully delivered and did it at a star level. Three more gave you something real to hold onto. Six came up short. Two were solely due to injuries (Westburg, Helsley), two were due to persistent offensive limitations (Cowser, Henderson), one in a complex organizational context (Rutschman), and one who simply wasn't as sharp as we had hoped (Bradish).
The rotation benchmarks, taken together, tell an interesting story. Rogers and Baz both cleared 2 of 3, meaning the durability and underlying quality were present, but the ERA results ran slightly above target. Bradish made 29 starts after two lost seasons. All three of these guys were workhorses for the team this year, and all of them pitched very well for large stints of the season. There is a functional rotation here, even if none of the three hit all their marks. The rotation is not what cost this team October.
What cost them October is the lineup. Henderson, Cowser and Holliday, the players the team needed to break through offensively...didn't. Westburg was lost to injury at a position where depth was already thin. Alonso was spectacular. But one spectacular player in a lineup of question marks is how you go 79-82.
The benchmarks for 2027 will reset with new targets and, in some cases, new players in these slots. The hope is that the next time we run this evaluation, more of the results look like Pete Alonso's row in the table above. Stay tuned for more on our benchmark process for next season in the coming months.
Birdland Metrics tracks personalized benchmarks for the Orioles' core players throughout each season. Final stats sourced from our live data pipeline as of September 28, 2026. Full benchmark methodology and in-season tracking at birdlandmetrics.com/visualizations/core-benchmarks.