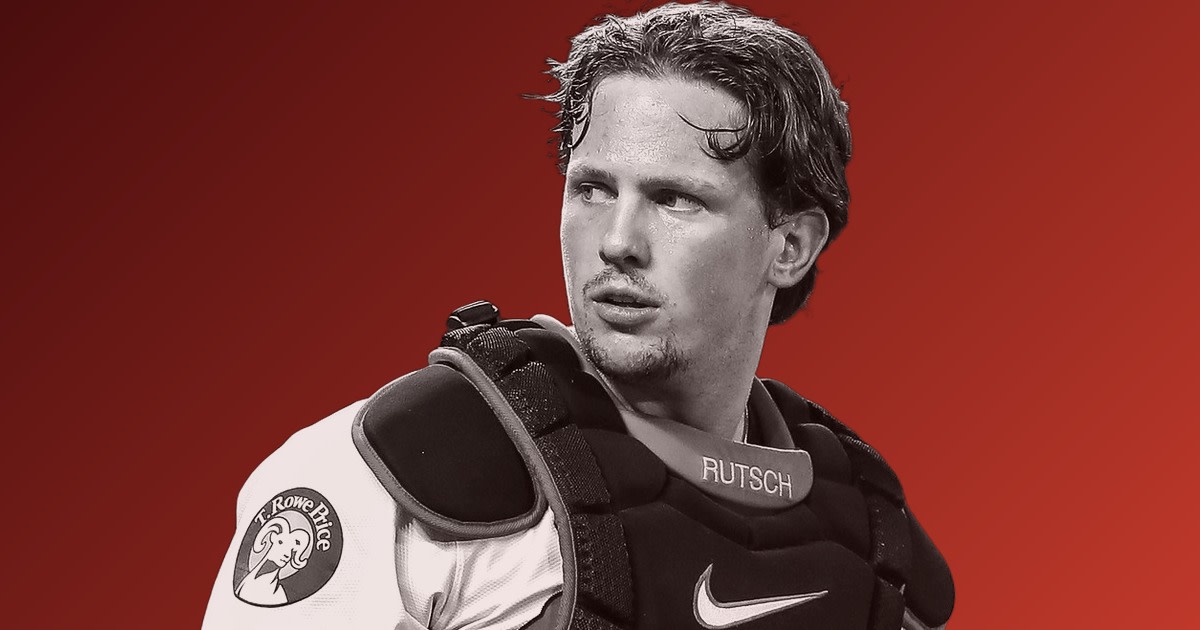
The Orioles were riding high at the mid-point of 2024, building on a stellar 2023 campaign that announced their return to contention. Their strong first half of the season (58-38) earned them impressive All-Star representation: Adley Rutschman won the AL starting catcher vote comfortably, Gunnar Henderson batted second in the lineup ahead of Juan Soto and Aaron Judge, and ace Corbin Burnes faced off against Paul Skenes in a marquee pitching matchup. Building on MVP-level production in 2023, the third-year catcher entered 2024 making a strong case as the best in baseball at his position.
Unfortunately, what followed has been the most frustrating stretch of his career. A foul ball off his right hand in late June of 2024 may have been the turning point — from that point on he hit just .207 to close out 2024, with his bat speed falling to the 13th percentile among all hitters. Then came a 2025 derailed by oblique strains on both sides of his body that limited him to just 90 games. If you're an O's fan, you've probably asked yourself the same question everyone else has: what happened to Adley? And is 2026 the year Adley bounces back, or has the 27-year-old already peaked?
We dug into the data to find out. We compared Rutschman's baseline performance (2022 through the 2024 first half — over 1,600 plate appearances), which we'll refer to as "All-star Adley", against his recent slump (2024 second half through 2025 — about 650 plate appearances), which we'll refer to as "slump Adley", using FanGraphs' regression methodology to separate real changes from statistical noise.
The verdict: while we found some small but real declines and a dose of bad luck, Adley's core skills remain intact, and a hitting rebound in 2026 looks likely.
But before we get into what changed and what didn't, it's worth understanding how we know what to trust.
How We Separated Signal from Noise
When assessing player talent, every baseball metric has a tipping point — a number of plate appearances or balls in play where the stat stops being noise and starts being meaningful. Strikeout rate stabilizes quickly (around 60 plate appearances), which is why we can say with high confidence that Adley's strikeout rate is genuinely unchanged, and slightly better than "All-star Adley". BABIP, on the other hand, takes over 800 balls in play to stabilize — meaning his recent .240 BABIP is still more noise than signal.
This is the foundation of FanGraphs' regression methodology: you can figure out how seriously to take a stat change by asking two questions. First, how large is the sample relative to the stat's stabilization point? And second, how big is the actual change? For those interested, we break down this methodology even further in an explainer article.
We took these two very distinct periods of Adley's career thus far (younger, "All-star Adley" vs. recent, "slump Adley") and ran an analysis across all of his key batting metrics. The chart below maps every notable metric that has established stabilization points — it shows how confident we are in the change in his metrics via the size of the sample (x-axis) versus how large the change was (y-axis). Metrics at 100% stabilization and the steepest deltas are the most trustworthy signals. Metrics that haven't reached 100% stabilization and/or do not have steep deltas are less reliable. The delta of plus or minus 2% is also worth noting, anything closer to 0% is less meaningful.
The takeaway: the metrics we're most confident in paint a mixed picture. Strikeout rate is essentially unchanged, and trending even better than "All-star Adley" numbers — Adley's eye at the plate is as good as ever. But walk rate and hard-hit rate have crossed the decline threshold with full confidence, suggesting a real (if modest) dip in approach aggressiveness and contact quality. Line-drive rate is trending the same direction at 76% stabilized. BABIP, at just 54% stabilized, is still more noise than signal.
His Core Skills Haven't Budged
Let's start with the good news, because there's plenty of it.
Rutschman's plate discipline — the foundation of everything he does at the plate — hasn't budged. His strikeout rate actually improved slightly across these two stages of his career (16.6% to 15.8%). There are also a handful of metrics that we've mentioned in the footnotes of the visualization (in-zone contact rate, chase rate, and whiff rate) that do not have published research around their stabilization points, so we can't firmly state our confidence in these changes, but they all do trend in the direction of maintained or improved plate discipline across the two periods assessed.
Although the walk rate decline looks bleak, it is worth noting that due to a brutal second half of 2024, his walk rate decline in the "slump Adley" period may be weighted down a little unfairly: Rutschman walked in about 13% of his plate appearances during his peak — well above league average. That slipped to under 10% in the second half of 2024. But, and a big but, it's worth noting that his 2025 walk rate (11.0%) was actually pretty healthy for his standards (he consistently has a walk rate above league average) and looked more like the 2023 Adley. Walk rate stabilizes at around 120 plate appearances, so with 650+ in our "slump Adley" sample, this is a real change worth watching.
His plate discipline skills are what made him the #1 overall pick. They're the skills that are hardest to lose and most predictive of future success — and, as the chart above shows, they're the metrics we have the most confidence in. Whatever went wrong during the "slump Adley" period, it wasn't that Adley forgot how to see the ball. The underlying machinery is working just fine.
What Changed: The Batted Ball Puzzle
This is where things get murkier. Without consensus research on how quickly these advanced Statcast metrics stabilize, we can't say definitively whether these are real declines or just noise. Still, a few trends stood out.
He's not hitting the ball as hard. His hard-hit rate dropped about 2.6 percentage points across these two periods, and his barrel rate dipped from 7.3% to 5.6% (important caveat below). These are modest declines, but with a large enough sample to take them seriously.
But here's the interesting caveat on this piece: his barrel rate and exit velocity actually recovered to 2023 levels in 2025, and his exit velo (89.4 mph) was the highest of his career. When he squared up a ball last season, he was doing it as well as ever. The issue isn't the quality of his best contact — it's where all the other contact is going.
His batted ball profile shifted in a weird way. This is the most confusing part of the Adley puzzle, and honestly, we don't have a clean answer for it.
In 2024, Rutschman started hitting way more fly balls — his average launch angle spiked to a career-high 18.8 degrees. Then in 2025, it swung the other direction: his ground ball rate surged to a career-high 43.4% while his line drive rate fell to just 22.5%. It looks like an over-correction — maybe Adley or the coaching staff saw the fly ball rate spike and adjusted, but went too far, turning would-be line drives into grounders.
Year | Avg Launch Angle | Ground Ball% | Line Drive% | Exit Velo |
|---|---|---|---|---|
2022 | 15.6° | 40.0% | 25.1% | 87.9 mph |
2023 | 12.6° | 42.9% | 26.4% | 88.4 mph |
2024 | 18.8° | 34.9% | 25.5% | 88.2 mph |
2025 | 13.7° | 43.4% | 22.5% | 89.4 mph |
Could be a mechanical thing. Could be how pitchers are attacking him. Could be noise in a relatively small sample (272 balls in play in 2025). Probably some combination of all three. We'll learn a lot in April.
The Luck Factor: This Is the Part That Should Make You Feel Better
Now for another important layer to this analysis.
Expected Batting Average (xBA) calculates what a hitter's average should be based on how hard they hit the ball and at what angle — stripping out luck entirely. In 2025, Rutschman's xBA was .241. His actual average? .220. That's a 21-point gap, by far the largest of his career.
Year | Expected AVG | Actual AVG | Luck Gap |
|---|---|---|---|
2022 | .243 | .254 | +11 pts |
2023 | .289 | .277 | -12 pts |
2024 | .254 | .250 | -4 pts |
2025 | .241 | .220 | -21 pts |
Translation: 21 points of Adley's batting average were eaten by pure bad luck. Balls that should have been hits found gloves. Line drives went right at defenders. The baseball gods decided it wasn't his year.
This will correct itself. Players don't consistently underperform their expected stats over time. Those 21 points are coming back.
So What Should We Actually Expect in 2026?
Rutschman's .220 average was the product of two things: a modest real decline in contact quality and bad luck. The luck part will normalize. The contact quality part might bounce back.
That gives us three scenarios:
The floor (.240-.250): Contact quality stays where it is, but his luck normalizes. He's a .245 hitter with an above-average OBP and good defense. Not what we hoped for, but still a valuable everyday catcher.
The likely outcome (.255-.265): Some contact recovery plus normal luck. A .260 hitter with a .340 OBP and great defense is still an All-Star catcher — and still one of the best catchers in baseball.
The ceiling (.270-.280): Full contact recovery plus normal luck. If the hard-hit and launch angle issues were mostly noise or fixable mechanical tweaks, we get 2023 Adley back.
What to Watch in April
You don't need to be a data scientist to track Adley's 2026 recovery. Here are the signals that matter most:
Is he hitting the ball hard again? Check his Hard Hit% on Baseball Savant. If it's above 38% after a few weeks, the contact quality is recovering. If it's stuck around 35%, the decline might be real.
Is his average tracking his expected average? Savant also shows xBA. If the gap between his actual average and xBA is small (under 10 points), the bad luck from 2025 has passed. If he's still underperforming by 15+ points, the correction is still coming — but it will come.
Is he walking again? We'll be closely watching his walk rate. He was able to recover from a drastic dip in the second half of 2024 by posting an 11.0% walk rate in 2025. That's much better than his 2024 number, but still below peak-Adley (+13% BB% in 2022 and 2023). If it falls below 10% again, something in his approach may have shifted permanently. We have this stat on our benchmarks page, so you can see this one update every morning on our site.
Where are the batted balls going? The ground ball spike was the big mystery of 2025, and the fly-ball spike was the big mystery of 2024. If his line drive rate climbs back above 24% and his ground ball rate drops below 42% by mid-April, last year's distribution was probably an aberration.
Is he still striking out at the same low rate? This should be the easy one. His K% has been rock-solid his entire career. If it stays below 17%, the foundation is there regardless of what else is happening.
The Bottom Line
Adley Rutschman's "slump" period has been bad. But it's a specific kind of bad — one where the surface numbers seem worse than the underlying skills. His plate discipline is elite and unchanged. His barrel rate and exit velocity bounced back in 2025, even while dealing with nagging injuries. He lost 21 points of batting average to plain old bad luck.
The real concerns — a dip in hard contact, fewer line drives, more ground balls — are worth monitoring, but they're modest. And even in a scenario where those declines stick, normalizing the luck alone gets him back to .240-.250.
The most likely version of Adley Rutschman in 2026 is a .255-.265 hitter with a .340 OBP, elite pitch framing, and above-average defense. That's a top 5 catcher in baseball. He's not the 2023 version right now, but he's far from broken.
Expect a bounce-back. The only question is how high. Stay with us as we follow his metrics this season.
Analysis based on Baseball Savant data through March 2026. Regression methodology per FanGraphs and Baseball Prospectus research.