Every morning, the Birdland Metrics projection model simulates 10,000 seasons for each MLB team. The result is a win distribution — a curve showing the range of likely outcomes and how often each win total appears. This post tracks all five AL East teams in a single overlay and breaks down each team's projection individually. The charts always reflect the latest model output. The commentary below is updated weekly.
The Division at a Glance
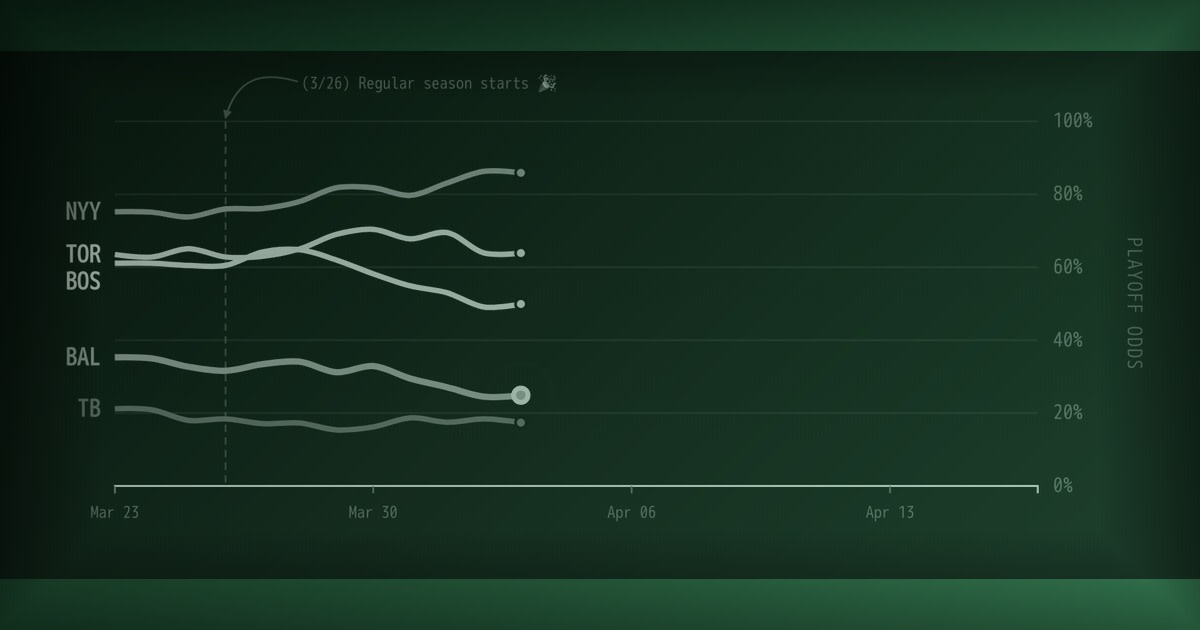
The overlay below shows all five AL East win distributions on the same axes. Where the curves overlap, the model sees a competitive race. Where they separate, the gap is real.
The AL East shapes up as a three-tier division entering 2026. The Yankees sit alone at the top with a median projection of 88 wins. Toronto and Boston form a tightly bunched middle tier at 86 and 85 wins respectively — close enough that the model can barely distinguish between them. Baltimore trails this pack at 81, and Tampa Bay projects as a sub-.500 team at 78.
The most important feature of this chart isn't where the peaks sit — it's how much the curves overlap. The Yankees-Blue Jays-Red Sox distributions share significant area in the 85-to-92 win range, meaning there are plenty of simulated seasons where any of those three teams finishes on top. The model gives the Yankees the best odds, but this division is far from settled. It's also another important reminder that our ELO-based model is weakest in the pre-season, but will become much more confident as the 2026 season progresses.
Baltimore's curve overlaps with the bottom of the contending tier. In roughly one out of four simulations, the Orioles reach 85+ wins — enough to enter the wild card conversation. Tampa Bay's curve barely touches the playoff-relevant range.
New York Yankees
2/25/2025
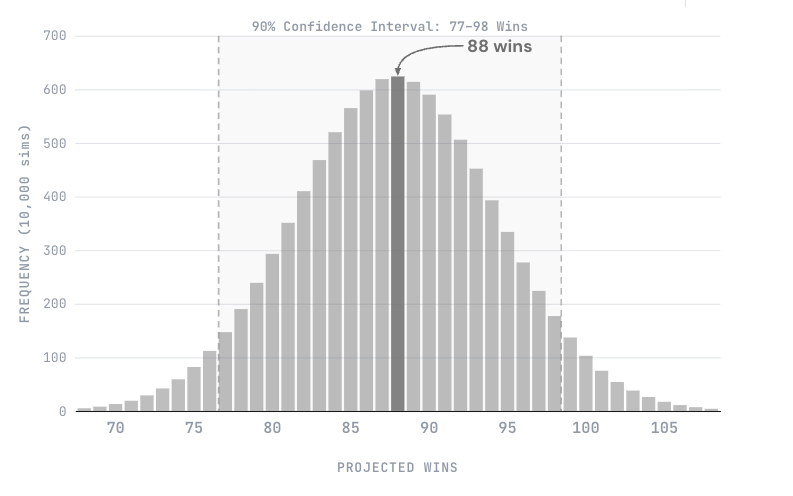
The Yankees project as the division's best team at 88 wins, carrying the highest end-of-2025 ELO in the AL East (1675.6). Their distribution is relatively tight — the model is confident about who this team is. Even at the 10th percentile, New York is an 82-win team. At the 90th, they're pushing 94.
The preseason blend pulled the Yankees' projection down from their raw ELO — mean reversion and a negative offseason WAR adjustment (-1.4 blended WAR) both compress the number. But the starting point was so high that New York still projects comfortably on top.
The narrow spread reflects sustained performance across multiple seasons. ELO's cumulative memory rewards consistency, and the Yankees have been compounding wins for years.
Toronto Blue Jays
2/25/2025
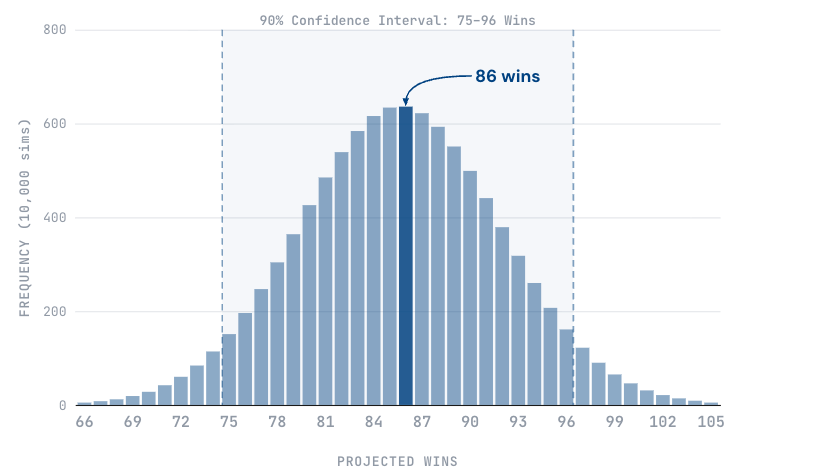
Toronto projects second at 86 wins, a testament to how much momentum a World Series run carries into the following season. The Blue Jays gained 149 ELO points in 2025 — the largest single-season jump in the division — but started from a low baseline after a disappointing 2024.
Their distribution nearly mirrors Boston's, shifted just one win higher. The overlap between these two curves is almost total, which means the model sees the second and third spots in the division as essentially a coin flip. Toronto's edge comes from the October run — ELO rewards teams that win games in the biggest spots.
The Blue Jays' offseason was roughly neutral (-0.2 blended WAR), so the projection is almost entirely a function of where they finished 2025. If the core team repeats their outstanding form in 2026, this projection feels conservative. If there's any postseason hangover, or a repeat of their 2024 form, 86 wins could be the ceiling rather than the median.
Boston Red Sox
2/25/2025
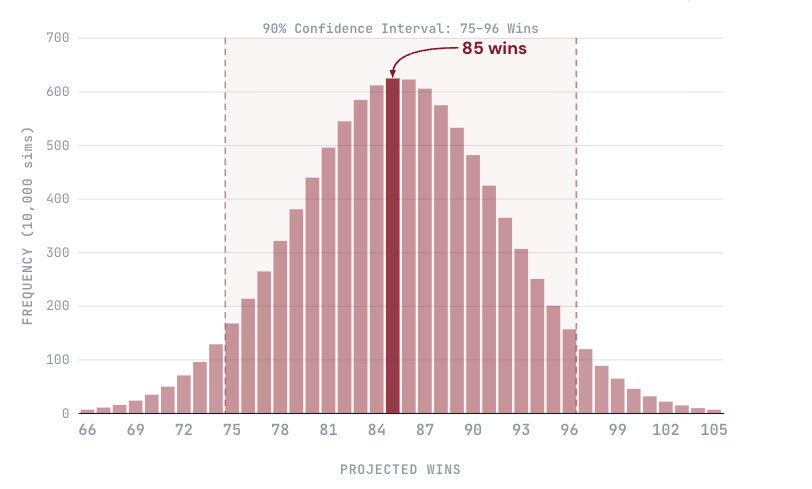
Boston projects at 85 wins, just one game behind Toronto and squarely in the playoff conversation. The Red Sox carry an end-of-2025 ELO of 1622 — built on a strong regular season even if October didn't go their way.
The shape of Boston's distribution is nearly identical to Toronto's: a standard bell curve with moderate spread. The two teams are so close in the model's eyes that a hot April from either one could swap their positions for the rest of the season. The 85-to-86 gap is well within normal variance.
Boston's offseason was essentially a wash (+0.1 blended WAR). They didn't get meaningfully better or worse on paper (even with large starting rotation signings, they lost key players), which means the 2026 projection is a direct read on where the 2025 roster left off. For the Red Sox, the path to winning the division runs through outperforming this median — and through the Yankees underperforming theirs.
Baltimore Orioles
2/25/2025
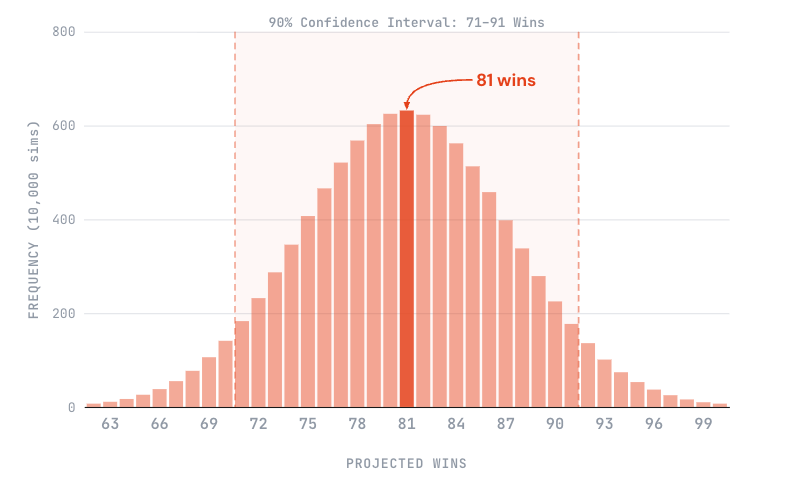
Baltimore projects at 81 wins — fourth in the division, but with a distribution shape that tells a more interesting story than the median suggests.
The Orioles had the best offseason in baseball, adding +4.7 blended WAR through signings and trades. That's a significant talent infusion, and the model credits it: the preseason WAR adjustment boosted Baltimore's ELO by 40 points, the largest positive shift in the division. But the starting point was low. A disappointing 2025 left the Orioles at an ELO of 1510, barely above the league average.
The result is a distribution centered at 81 but with meaningful right-tail upside. At the 75th percentile, Baltimore is an 86-win team — competitive with Boston and Toronto. At the 90th percentile, they're at 88 and genuinely in the division race. The model is uncertain about this team in a way it isn't about the Yankees or the Rays, and that uncertainty cuts in both directions.
The key question the model can't answer yet: will the offseason additions perform closer to their track records or their age-adjusted projections? Pete Alonso's historical average is 2.8 WAR but his Marcel projection is 0.7. Chris Bassitt goes from 2.4 to 0.2. If Baltimore's veterans play like their histories suggest and their solid core of young players bounce back from a dismal 2025 campaign, the Orioles will outperform this projection. If the reverse happens, 81 wins is about where they'll land.
Tampa Bay Rays
2/25/2025
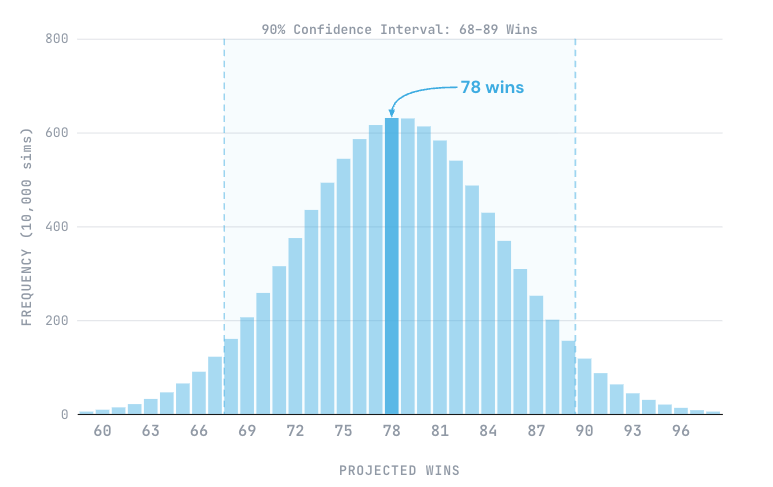
Tampa Bay projects at 78 wins, the lowest in the division by three games. Their distribution is centered firmly in the mid-to-upper 70s with virtually no overlap with the playoff-relevant range.
The Rays enter 2026 with a 1494 ELO — a reflection of a sub-.500 2025 season — and an offseason that made them marginally worse (-0.7 blended WAR). The preseason blend compresses the rating toward 1500, but there isn't much to compress when a team is already near the league average.
Tampa Bay's 90th percentile is roughly 84 wins. That's a respectable season in isolation, but in this division it would still leave them behind three or four other teams. The model sees a team in a transitional year.
The standard caveat applies: if any organization can outperform a projection built on roster talent and prior results, it's the Rays. Tampa Bay's track record of developing undervalued players and extracting wins from rosters that look thin on paper is well-documented. ELO can't model that institutional edge. But the gap between 78 wins and a playoff spot is wide enough that even a Rays-style overperformance would need to be historically significant.
How to Read This Through the Season
These distributions represent the model's best guess before a single 2026 game is played. They'll shift — and narrow — as the season unfolds.
Opening Day through May: The curves remain wide. Early results shift ELO game by game, but the preseason anchor still carries significant weight. A 20-10 start from Baltimore would begin closing the gap with the top tier, but wouldn't override the preseason overnight.
June through July: By mid-season, the model has incorporated roughly 80 games of data. The preseason signal has nearly faded. Distributions tighten. The separation between genuine contenders and pretenders becomes clear.
August through September: The distributions are narrow and track actual standings closely. This is when the projections — and the playoff odds derived from them — are most meaningful.
Check the overlay chart at the top each week to see how the curves are shifting. When a team's peak moves left or right relative to the others, that's real movement in the model's assessment.
Weekly Update Log
This section tracks notable projection movement week over week.
Week of February 25, 2026
Initial projections published. The model's preseason view:
Team | Median Wins | 90% CI | Playoff Odds |
|---|---|---|---|
NYY | 88 | 82–94 | 74.4% |
TOR | 86 | 80–92 | 60.7% |
BOS | 85 | 79–91 | 63.1% |
BAL | 81 | 75–87 | 37.1% |
TB | 78 | 72–84 | 20.1% |
The Yankees hold a 2-game edge at the top — modest but meaningful in a simulation model. Toronto and Boston are separated by a single win, close enough that the model treats them as functionally equivalent. Baltimore sits 7 games back of New York but only 4 behind the middle tier. Tampa Bay is the clear outlier.
Week of March 4, 2026
Not much movement in the projections as we are still relying on our baseline ELO ratings and the total team WAR projections from FanGraphs. We do not expect to see much of a divergence from these estimates until the season starts. We'll check back in next week to see if there's been any meaningful shift.
Week of March 11, 2026
Is it Opening Day, yet? We are almost there! Still not much movement in the projections. Most of the movement you see on the race tracker on the home page is due to statistical noise by the 10,000 simulated seasons each morning -- the model doesn't arrive at the same distribution every morning, so there will be slight variance in win projections and playoff odds until the first game of the season. There's been a slight down-tick in Fangraphs projected win total for the Orioles since last week -- it's now down to about 83 wins (from 85 wins in early February). This again is converging with our latest model runs. We'll know much more in less than two weeks, but for now, I expect we'll stay close to this projection until March 26th.
Week of March 18, 2026
We are just over one week away! You may have seen some subtle movement in a few AL East team playoff odds between March 15th and March 16th, primarily for the Orioles, Blue Jays, and Red Sox. The Orioles dropped about 2 percentage points, Toronto gained about 4 percentage points, and the Red Sox dropped about 2 percentage points. The reason for these small shifts is due to my examination of late-season tie-breaker scenarios. I added more randomness around tiebreakers at the end of the season in the event that two teams have the same record in late September. The previous code in the model had a very agnostic way of handling this, which I thought was penalizing teams a bit unfairly. Therefore, I made a small adjustment to make it more random and fair for all teams. It's a small adjustment, but I noticed that the Orioles were getting an over-representative edge in tiebreaker wins, which inflated their playoff odds slightly. This also was then hurting the Blue Jays a little. Regardless, these are very small tweaks that'll hold little/no weight once the season starts and we start to accrue data. I'll have one more pre-season post next week on the eve of opening day.
Week of March 25, 2026
Tomorrow is the big day! There was a little additional subtle movement in the AL East playoff odds today due to teams starting to officially designate players on their roster to the IL. As a reminder, our model picks up and penalizes IL designations against a teams ELO. Therefore, the recent injuries to Keegan Akin, Heston Kjerstad, Andrew Kittredge, Jackson Holliday, and Jordan Westburg all had small effects on the teams projections based on their reduced expected playing time. I expect these effects to be very small relative to the soon-to-be in-season game results, which will hold much more weight, especially as the season progresses. Therefore, I wouldn't take too much stock in the movement in projections this week. Real baseball is about to start, and the playoff odd shifts will become increasingly more meaningful.
Week of April 2, 2026
Now that the season is underway, we will be tracking this weekly in a separate model updates page. You can read our takeaways of the model shifts here.
Key storyline to watch: Baltimore's offseason additions (+4.7 blended WAR) were the largest in the division, but the model is waiting to see them translate into wins. The Orioles' right-tail upside is real — roughly 25% of simulations have them at 86+ wins. Whether they reach that upside or regress toward the median will be the division's most interesting subplot through April and May.