
The calendar is getting ready to turn over to August and the Baltimore Orioles are 53–56. The playoff probability model has them at 20.4% here on the last day of July. Two and a half games out of the third wild card with just a few days before the trade deadline.
Our Birdland Metrics model produces that 20.4% by simulating the remaining 53 games thousands of times, weighting each path by its probability. Right now, 8,000 out of each morning's 10,000 simulations lead to the Orioles missing the playoffs. But the model is also, implicitly, telling you something about what the paths that don't lead there look like. The schedule makes that explicit.
Who Baltimore Is Actually Chasing
First, let's quickly clarify the field. Pending a major skid by Tampa Bay and/or New York, these two teams are effectively locked into playoff spots, at 99.6% and 98.7% playoff odds respectively. One of them is almost a certain lock to win the AL East, the other will easily take a wild card spot. That leaves two spots up for grabs. In June, the AL conference was extremely wide open. But, as the summer has progressed, it's finally starting to weed out teams like the Angels, Atheletics, Royals, and possibly the Blue Jays and Tigers. That means, the Orioles are left competing with Boston (79.1%), Cleveland/Chicago (67%), Houston (43.3%), Seattle (34.0%), and Minnesota (21.4%) for wildcard spots two and three.
August Is the Prerequisite
It's important to remember that our schedule leverage generated from our team projection model recalculates after each series. Therefore, although we currently have higher leverage series projected later in the season (i.e. September), each series "importance" is contingent on surviving the earlier tests. For example, the Boston series in September only matters if August goes well enough to keep the season alive. These leverage scores will readjust as the games continue to play out here over the final two months.
The first huge test for the Orioles will be the August 10th–13th series at Target Field against the Twins. It could be a direct knockout round wearing a regular-season uniform. If the O's can win that road series, they could gain some early separation. However, if they lose it, the gap widens against Baltimore's odds of playing October baseball.
Then, we have the August gauntlet.
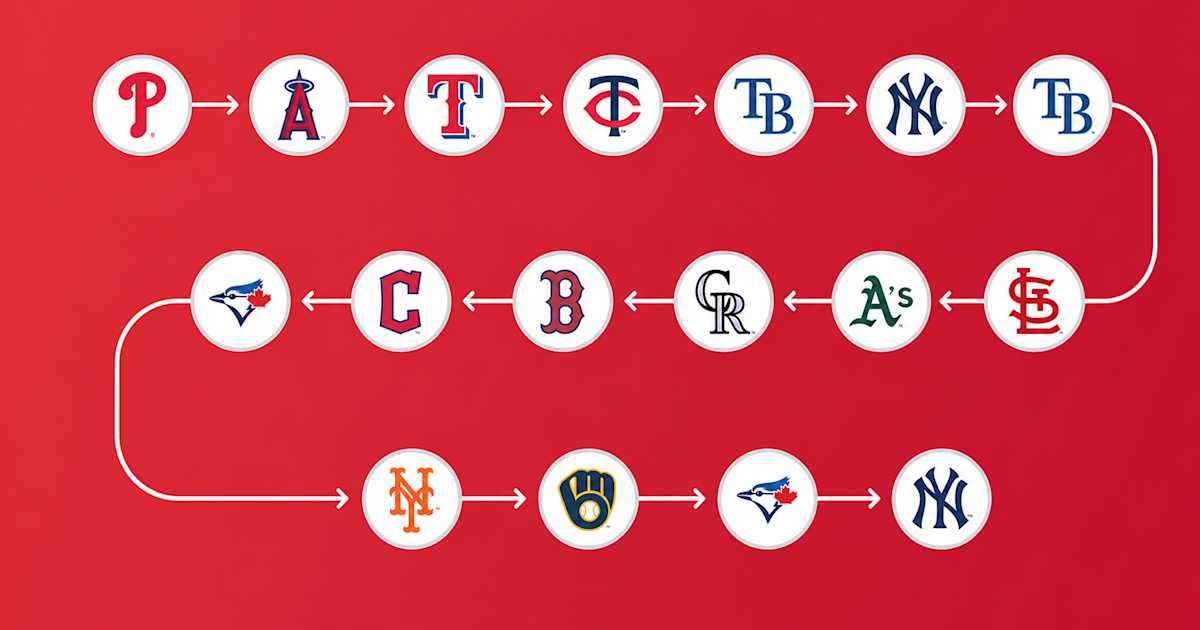
August 14th–17th at Tampa Bay. Four games on the road against a team with the division currently locked up. The model has Baltimore as a heavy road underdog. The last time they were at the Trop, it went very poorly. Arguably one of their worst series all year, they were swept in three games back in May. Hopefully, down the stretch here they can turn the tide. Right now, this is the second-highest leverage series remaining. Coming away with a series split or win would be huge.
August 18th–20th vs. New York Yankees (home). The Yankees follow immediately back at Camden Yards. Home field brings Baltimore close to even (52.0% win probability for the series right now, despite trailing New York by 34 Elo points). This one has a lower leverage score than the Tampa series, but a strong showing here is still really important. The O's can't get swept, and they need to eek out a game or two.
August 21st–23rd vs. Tampa Bay (home). Right after the Yankees leave town, the Rays fly in to play the O's again. Baltimore is a slight favorite here (52.7% win probability) with the home field advantage, but it also is showing as a medium-to-high leverage series at the moment.
Three division series in ten days. Ten straight games of baseball against the top two teams in the AL East. The outcome of those ten games will determine whether the Boston series in September is a must-win or a campaign-over. There is no softer way to say it.
The Single Most Important Series on the Schedule (Currently)
If the O's are able to outperform expectations in August, things could get very exciting in early September.
Right now, our schedule leverage calculations are showing the September 3rd–6th series against the Red Sox as the highest-leverage series remaining. A huge, 17.5 percentage point counterfactual swing in playoff odds.
Why is this such an influential series right now? Well, besides Boston likely being a direct competitor, this series is at home, where win probability is elevated. It also arrives in early September, when the temporal weight of each game is at its highest. And it's a four-game series, which means the leverage compounds across every at-bat and game.
The Rest of September
We won't talk about the the remaining opponents post the early September series against Boston. If they make it through this really tough stretch of games, they will have earned a chance to compete for a playoff spot. Our model thinks they will go 6-7 across the 13 games in mid-August. If that's the case, they are likely going to be pushing themselves out of the playoff race. But, if they can win a few more games than this expectation, say 8-5, they could be in a strong position heading into September and the pivotal Boston series.
The Closing Argument
We'll end by saying that the current outlook for the Orioles is challenging. The argument from the schedule is not that the Orioles will make the playoffs. However, there is a path. The games that decide this season are identifiable, several are at home, and none of them have been played yet. The path requires winning in Minnesota before the August gauntlet begins, surviving back-to-back Tampa Bay series while splitting with the Yankees, and then closing out four games against Boston in early September at Camden Yards.
If they can do all of that the O's current 20.4% playoff odds becomes something much larger. Our model already knows this. Those odds are the probability-weighted average across thousands of simulated paths, and some of those paths look exactly like the August the Orioles need to have.
The real question is, can the Orioles navigate this gauntlet and keep their playoff hopes alive?
Leverage scores and playoff odds derived from the Birdland Metrics Monte Carlo simulation model, updated July 30, 2026. Explore the full Schedule Leverage visualization