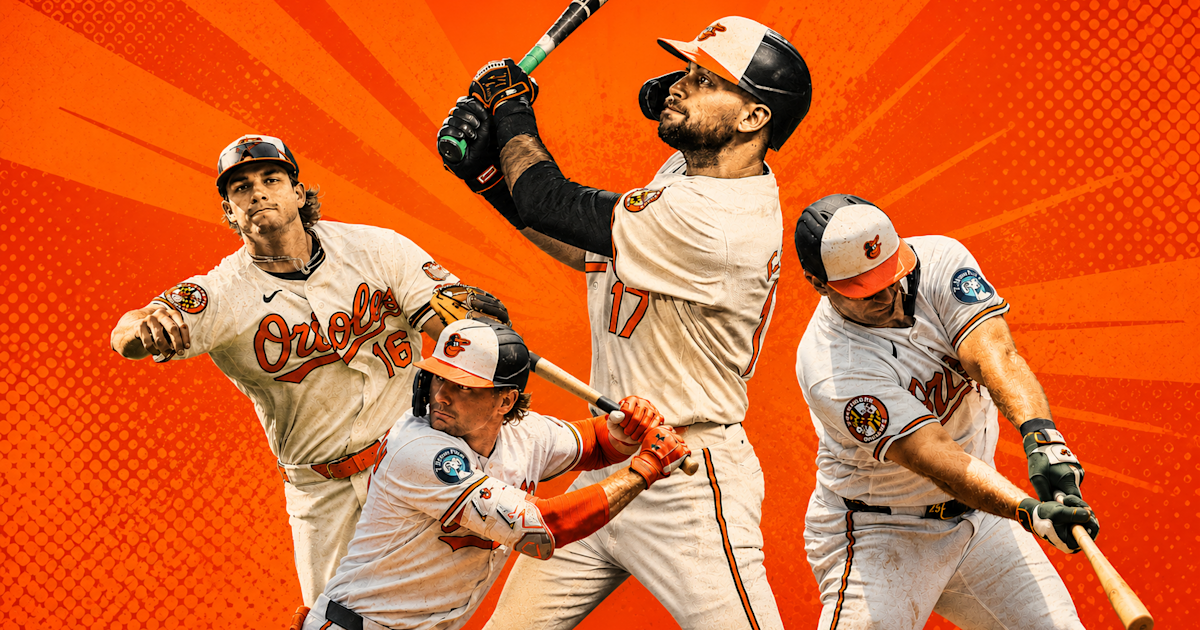

The Orioles playoff odds heading into the weekend series against Tampa Bay was a dismal 8.8%. Their chances looked bleak, and they had to somehow find a way to stack wins against a Rays team that had won 9 straight and carried the second-best record in baseball. Against all the odds, the Orioles went to Tampa Bay and took three out of four. Over the four games, the offense mashed. They put up 26 runs against a Rays pitching staff that had been quietly above average all season. The O's slash line: .293/.358/.503, with 8 home runs and 44 hits in 166 plate appearances. Their season baseline entering the weekend series sat at .234/.319/.393.
So, what changed? The data tells a specific story, not about the Rays pitching poorly, but about how Baltimore's hitters handled two-strike counts differently than at any other point this season. And when they did see secondary stuff late in counts, they hit the ball well.
To understand why that matters, you have to understand what has defined this Orioles offense all year.
The Context: An Offense Built on Fastballs
All season, Baltimore has been one of the easiest teams in baseball to pitch to with a plan. Against fastballs, they've been above average: .258 batting average. But when pitchers threw them breaking balls or offspeed pitches, the results collapsed: just a .213 batting average and 31.5% strikeout rate on sliders, .233 batting average and 25.4% strikeout rate on changeups, and .184 batting average and 35.1% strikeout rate on curve balls. Baltimore Sports and Life's Ben Palmer published one in May headlined "At some point, someone's gotta hit a curveball."
Major League Baseball teams have taken note: throw secondary pitches, throw them early, and don't give them anything to drive. It's part of the reason why the Orioles get into so many two-strike counts, second-most in baseball at 54.6% of plate appearances, and why, when they do, pitchers have felt comfortable going right back to the breaking ball.
However, something shifted over the weekend in Tampa.
The O's worked into a lot of two-strike counts, but thrived in them
The first thing that stands out is how often the Orioles fell into two-strike counts during this series. 60.5% of plate appearances reached a two-strike count, meaningfully higher than their season rate of 54.6%. Context on that baseline: Baltimore's 54.6% two-strike PA rate is 2nd-highest in MLB, they get into deep counts more than nearly any other lineup. But even by their own standards, this series pushed it further.
But here's where the narrative flips: they were dramatically better at surviving those counts.
Situation | Series | Season |
|---|---|---|
PA reaching 2-strike count | 60.5% | 54.6% (2nd in MLB) |
K rate when in 2-strike count | 37.6% | 44.5% |
Hits in 2-strike PA | 25 (24.8%) | 337 (13.6%) |
The strikeout rate when already in a two-strike hole dropped nearly seven percentage points. Hits in two-strike plate appearances nearly doubled as a share. It seems like the O's batters were ready for whatever the Rays pitchers were throwing at them with two strikes.
Pitchers Moved Away from Breaking Balls
One explanation: the Rays adjusted their pitch mix in two-strike counts in a way that played right into Baltimore's hands.
Over the full season, opposing pitchers throw 35.6% breaking balls in two-strike counts against the Orioles: sliders, sweepers, curveballs. In this series, that number dropped to 22.7%. Fastballs jumped from 46.1% to 54.2% of two-strike offerings. Offspeed climbed from 18.2% to 23.1%.
Pitch Family | Series % (2-strike) | Season % (2-strike) |
|---|---|---|
Fastball (FF/SI/FC) | 54.2% | 46.1% |
Offspeed (CH/FS) | 23.1% | 18.2% |
Breaking Ball (SL/ST/CU) | 22.7% | 35.6% |
Whether this was an intentional Tampa Bay scouting directive or simply pitchers losing confidence in their breaking balls under pressure, the result was the same: the Orioles saw an unusually fastball-heavy diet when the at-bat was on the line.
When They Did See Secondary Stuff, They Hit It Well
In two-strike counts, the Orioles have been roughly league-average all season on fastballs and very poor on secondary pitches. This series was the inverse.
Pitch Family | Series Whiff% | Season Whiff% | Series xwOBA (contact) | Season xwOBA (contact) |
|---|---|---|---|---|
Fastball | 9.8% | 9.9% | .363 | .382 |
Offspeed | 9.6% | 14.4% | .646 | .371 |
Breaking Ball | 5.9% | 17.7% | .609 | .373 |
Fastball numbers were essentially unchanged from their season norms. But on offspeed and breaking balls, the Orioles were barely missing, whiff rates dropped, and when they made contact, they hit the ball hard and often.
The breaking ball contact story is particularly noteworthy: 5.9% whiff rate against spin in two-strike counts, down from 17.7% on the season. Even with a small sample of 51 pitches, it's a notable trend.

Pete Alonso and Gunnar Henderson Had A Great Series
Two hitters drove the production. Pete Alonso had 8 hits in the series with 2 home runs, hitting off all three pitch families. Gunnar Henderson collected 7 hits including a home run and a double, four of those hits came on Aug 14th alone. Coby Mayo added 3 hits with a home run on Aug 17. Christian Encarnacion-Strand had 5 hits with 2 home runs, both coming on offspeed pitches.
Can They Sustain This?
A four-game stretch doesn't rewrite who a team is. But the underlying numbers here are interesting, the xwOBA on contact against secondary pitches (.609-.646) indicates quality contact, not lucky outcomes. The whiff rates against breaking balls dropping from 17.7% to 5.9% with a two-strike count is also something that raises eyebrows a bit, even over a limited sample.
Two explanations aren't mutually exclusive: the Rays' staff leaned on secondary pitches less in pressure situations, and the Orioles hit them harder when they did. Whether this is a real adjustment by Baltimore hitters or a favorable matchup against a particular Tampa Bay staff, it's worth watching the two-strike whiff numbers going forward.
We've been saying it all year, but the Orioles have the baseline offensive talent to look like the lineup that came to play over the weekend. The question has always been whether they could sustain it against left-handed breaking balls and tight offspeed late in at-bats. For four games in Tampa, they answered that question.